How to Make Data Sing: The Art of Storytelling in Data Science
Why “Story Telling is important”
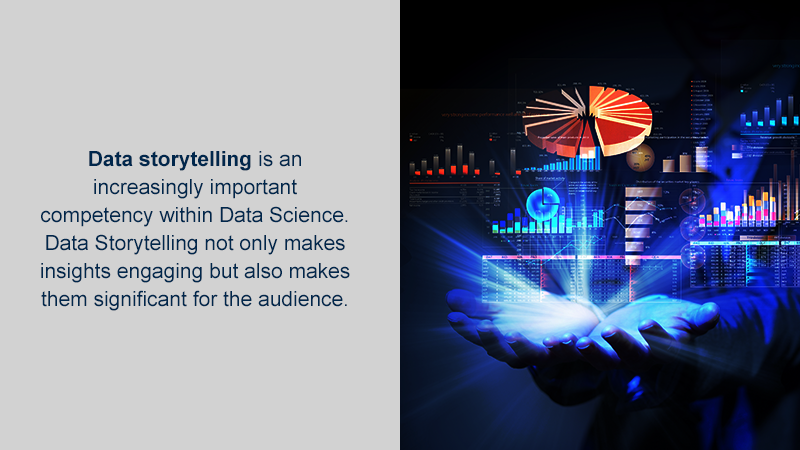
Data storytelling is an increasingly important competency within Data Science. Data Storytelling not only makes insights engaging but also makes them significant for the audience. Good data storytelling has become even more important today as evidenced by the insights conveyed about COVID-19. The pandemic has created the perhaps the most populous quest for data and statistics in our lifetime. It has highlighted the importance of the ability to convey insights from data in a way that is meaningful to people’s everyday lives. That same principle can be applied to business decision-making and the need for insights in support of it.
Basic steps in building a compelling story with data
The following 4 steps cover all the aspects that are important for your data story.
1. Create Data Stories for Target Audience
If you want to know how to create data stories, identifying your audience is the first task on your list. Every story has an audience. You can’t satisfy everyone with your story. But, there is a specific section of the audience that benefits from it.
2. Find Important Insights
You might think, “Hey! They are called insights because they are important!” Well, sorry to burst the bubble. The data can produce multiple insights that might not cater to your customer’s problems.
3. Craft a Storyline
This step is seemingly easy but practically the most difficult. However, you can master the art of data storytelling by ensuring that you consistently follow these 6 steps.
- Draft an outline first
- Start with the takeaways
- Find the analysis to support the takeaway
- Convert analysis to messages
- Structure the message
- Re-order your messaging
4. Focus on Design to Create Data Stories
Statistics can summarize the data but it may hide patterns in how the data is represented. Information designing visually represents data, which helps you locate patterns in data. Use visual techniques to map data to visual attributes.
Signs of a story well told with data
Stories are memorable, viral, and send an actionable message. That’s why we need more data storytellers than ever. When you intimately understand your business, you don’t need to stress about what to do next or where to spend time. The data is right in front of you, in a way that you can consume in seconds. This makes it easier for you to make the right decisions faster, which means you can act more confidently, move faster, and crush your goals.
Let us help you tell your story!
At Starr, we love bringing data to life through data storytelling, so users are free to focus on understanding and exploration of what really matters. We continuously challenge conventional thinking using a combination of our knowledge of design, the raw power of data and cutting-edge technologies to create powerful solutions to remove complexity and deliver a variety of data visualization tools.
Over the past 18 years, we’ve developed a reputation for excellence, forging long-standing relationships with a diverse portfolio of clients. We are proud when saying that most of our work comes from repeat business and client referrals.