
Unlocking the Power of Geospatial Data
The modern business world is an infinite jungle of data. Navigating this tangled landscape requires focus on meaningful information and skills to transform it into actionable insight. The emergence of new data types occasionally proves a distraction so it is important to recognize that tried and true measures are often the best course. Two data points typically overlooked share an origin dating back to the ancient Greeks: Latitude, and Longitude.
Today the practice of interpreting spatial data is an invaluable tool for Field Service management. Here are three ways geospatial analysis can add insight:
1. Knowing where things are happening provides a new level of context to what is happening.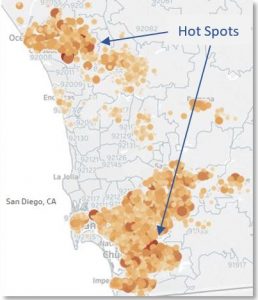
A dashboard reads there is an unexpected uptick in service calls. What customers are affected? Is there a pattern related to location? Are there other relationships that can help determine what action is needed?
A geospatial heat map can reveal hot spots of activity for related customers types or product groups in specific service territories.
Advanced data visualization tools like Tableau also enable interactive filtering and drill down to gain further insights.
2. Mapping results by location facilitates comparison of detailed data sets.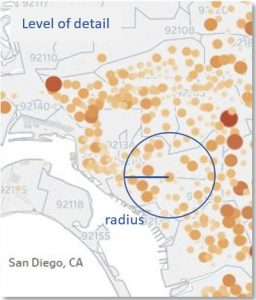
Well-designed dashboards are a great asset. However, there are only so many data points a typical visual like a trend line or bar chart can reasonably display at once. To get a detailed view of performance the solution is simple, map it!
By summarizing results to the geospatial center of a service area or common plant component it is possible to simply zoom in and compare results.
The radius selection tool in Tableau maps can also help select a specific set of points within a distance of the desired spot such as a dispatch center or customer service location.
3. Evaluating outcomes within actual business areas adds more value than static geographic boundaries.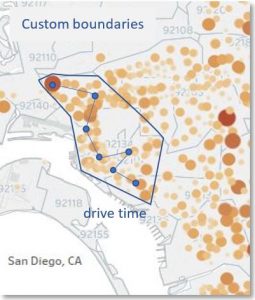
Visualizing data within standard postal areas such as Zip Code, County or State may not always provide meaningful insight. Spatial analysis offers the ability to apply boundaries unique to the business including service territories.
An added value to this approach is detailed calculations of technician drive times. When scaled up to multiple technicians in overlapping services areas, the analysis could reveal opportunities for efficiency.
Specialized data processing tools like Tableau and Alteryx paired with a skilled analyst can make short work of complex spatial and drive time analysis.